Simplicity Pays Off: Even basic testing and experimentation on your ecommerce platform can significantly increase profits by better satisfying customer needs.
Understanding Is Key: Truly grasping what your customers want can feel like a monumental task but is crucial for making your website more appealing to them.
Guided Path to Success: Anyone in the ecommerce space can enhance their site's conversion rates by adopting a structured approach to experimentation and optimization, regardless of expertise level.
Ecommerce conversion rate optimization is a process that empowers your business website to better cater to your customers' needs, ultimately boosting conversions.
While it may seem complex, even a simple testing and experimentation system can have a significant payoff, yielding higher profits.
We know that truly understanding your clients can be daunting. You can spend countless hours trying new things, attempting to understand what resonates with your audience.
But how do you determine if any of these efforts yield tangible results? Better yet, how can you make your ecommerce website irresistible to customers?

Whether you’re new to the ecommerce marketing world or you’re a seasoned expert, we're here to guide you through the process of getting maximum sales from your existing web traffic.
That’s right: There are answers to your burning questions about CRO for ecommerce, and you can learn how to optimize your customer’s journey online through effective experimentation.
Courtesy of Webistry, a data-driven marketing and experimentation agency based in Montréal, this in-depth guide will take you through a comprehensive 12-step process to run CRO-driven experiments and improve your ecommerce sales and boost conversions.
What Is Conversion Rate (CVR)?
Conversion rate is the metric that tells you how many of your site visitors are transforming into loyal customers or achieving a specific goal on your website.
Calculating this rate is simpler than you might think.
Just take the number of visitors who perform the desired action, like making a purchase, and divide it by the total number of visitors to your page. Multiply the result by 100, and voila! You've unlocked your conversion rate percentage.
Formula: Conversion Rate = (Total Goal Completions / Total Site Visits) x 100
What is the average ecommerce conversion rate?
The average conversion rate for an ecommerce website is typically 2-3%, although this number varies greatly depending on your vertical.
What is a good ecommerce conversion rate?
Seeing as how the average rate often tops out at 3%, a good conversion rate for ecommerce brands would be anything over 3%. Better than average has to be good, right?
What is Conversion Rate Optimization (CRO)?
Improving your CVR is how you maximize the traffic coming to your website—this practice is called CRO.
Ecommerce CRO involves reviewing your performance and conducting empirical experimentation on your assets over time to find what works best.
Once you have enough data, you can see which experiments have had a positive impact on your conversion rates and apply those changes at scale.
Often, the experiments you’ll use to determine what changes drive conversions are A/B tests.
What is A/B Testing?
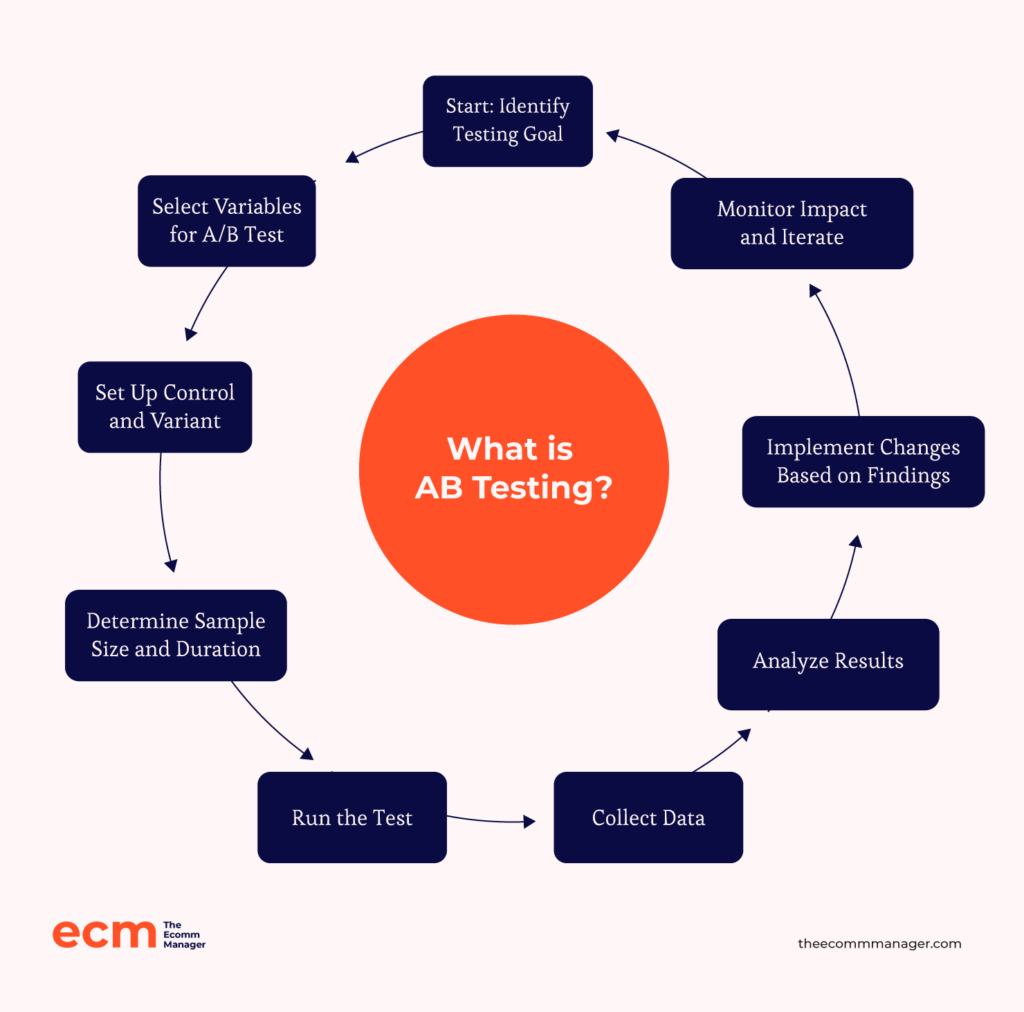
In an A/B test, users are shown one of multiple “variants” of an asset, such as a web page. We’ll be talking about A/B tests in this post a lot, so it’s good to know what it’s all about.
Some will see the original version (or “control” or version A), and others will see the new version or versions (the “variant” or version B).
The change could be anything from a rewritten headline to a whole new layout.
Though, it is best practice to change one thing per test in order to be exact about what moved the needle (like, say, a new button color or a better headline).
By recording the difference in how your users respond to the two variants, you can see whether this change makes a positive impact on your conversion rate.
If so, your test is successful, and you can scale this change to the permanent website.
Phase 1 | Setting Up For Success
Before you can really apply CRO, you’ll need to lay the groundwork to be able to run tests effectively. Here’s how to create well-structured tests that lead to valuable, insightful decisions.
Step 1: Invest in good data
To understand how your tests are performing, you need to set up basic reporting.
It’s not surprising that without proper data tracking, it’s impossible to understand how changes impact user behavior.
Focus on simple and ready-to-use data analysis platforms to start, like Google Analytics, Clarity, and Hotjar.
Google Analytics
GA provides highly granular data about traffic and user sessions on your website. This tool is a marketing essential, with the advantages of being completely free and as “out-of-the-box” as can be.
Learn where your users come from, how user behavior varies across pages, and even insights like pre-conversion browsing paths.
You can see the number of people who come in your digital door over time and how many of those have typically converted, helping to set benchmarks on what effect your experiments have had.
The old version of GA (Universal Analytics) and Google Optimize are no longer available, so learn how to work with Google Analytics 4 to get the data you need.
Hotjar and Microsoft Clarity
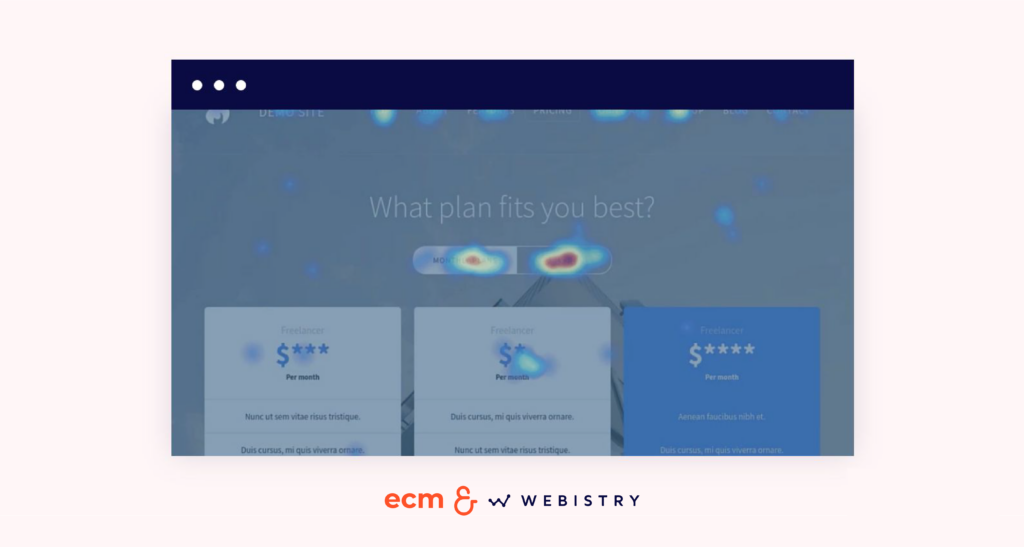
With these heat mapping tools, you can visualize and understand visitor behavior on your site, such as clicks, scroll patterns, and cursor paths.
They're incredibly useful for visualizing page-level engagement metrics and seeing how your users interact across A/B test variants.
Note that "down-the-funnel" conversions are better reported by a platform like Google Analytics.
Set these up early on in your CRO journey so that you start capturing rich data right away. That way, you can see how things change over time.
Discover more of the best analytics platforms for ecommerce to get your brand outfitted with the right reporting tools for scaling.

Step 2: Statistic fundamentals for A/B tests
To get a clear idea of your project plan, check your statistics fundamentals first.
You’ll need to evaluate risk and confidence factors to make decisions based on your test results. For now, focus on projecting your test lengths and required traffic levels.
Sample size
Use this statistics tool to determine how much traffic to run through your test based on the expected impact—referred to as Minimum Detectable Effect (MDE).
Not having enough traffic to be statistically relevant means you can’t trust that the results really mean anything.
A/B test calculator
This test calculator helps you analyze your test results.
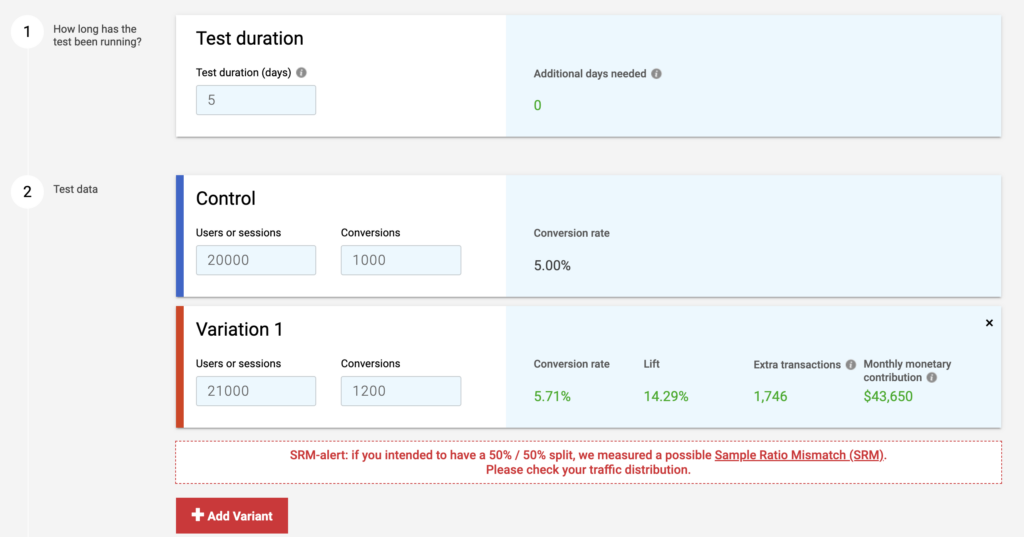
You can then determine the level of confidence (Statistical Significance) that your results hold and effectively judge how to act upon them.
In the realm of A/B testing, the certainty of your results when applying statistics can sometimes be complex to calculate.
Generally speaking, A/B testing statistics include more than the tools and basic concepts we’ve covered here. Be sure to check out CXL's A/B Testing Statistics Guide for more information.
Step 3: Choosing an A/B testing platform
Next, decide which testing platform to use. This is a crucial step in designing your ecommerce website's CRO strategy.
Once you begin, it’s preferable to use the same platform for consistency. Free A/B testing solutions are a great start.
Here’s a popular CRO testing platform for small businesses:
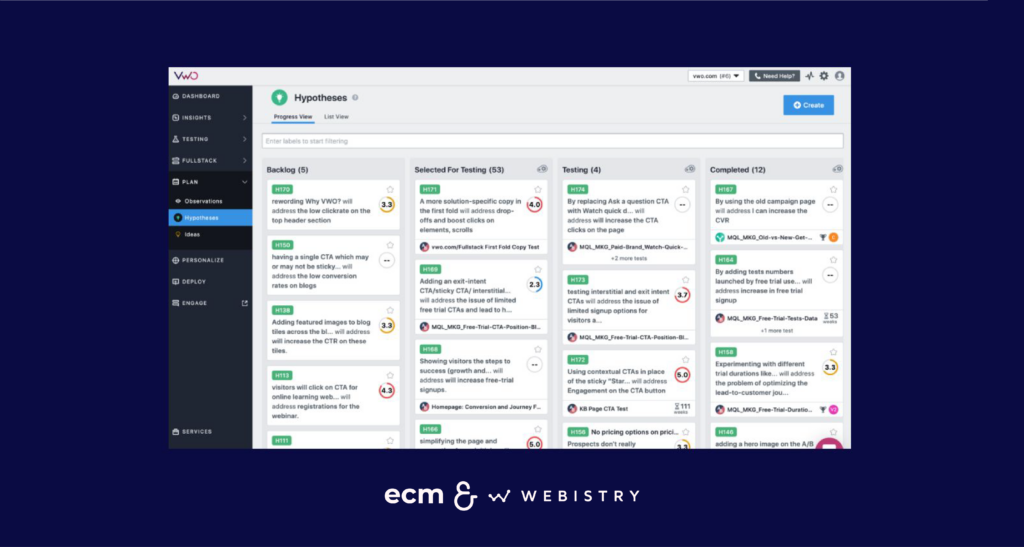
VWO starter plan
Free for up to 50K monthly visitors, the capabilities cover web, mobile, and server-side experimentation.
VWO allows you to begin running A/B tests easily and grow into paid plans with more features later.
Once you get comfortable with experimentation, explore premium options like Unbounce, Adobe Target, Optimizely, SiteSpect, Convert, and AB Tasty.
Step 4: Set your goals
Lastly, take a moment to think about your goals before you jump into running CRO experiments.
Ask yourself the following questions:
- What do I want to measure?
- What will this information tell me?
- What are the primary Key Performance Indicators (KPIs) that I’ll need to assess?
- How do I calculate these primary KPIs?
Keep in mind that while the best-case scenario is to optimize for bottom-of-funnel conversions, like purchases, the reality is that many stores will not be able to do so due to low conversion volume.
This is a common issue that even some larger enterprise businesses face, so don’t worry!
We suggest anchoring your experiments in higher funnel metrics like:
- On-page click through
- Engagement—which can relate to any behavior on the site
- Bounce rates
- Time on the site or on the page
- Actions like add to cart, initiate check out and add payment info
These metrics are all critical parts of the user journey and can be tested with the ultimate goal of pushing users down the funnel.
When setting your goals, remember to integrate your workflow and be thoughtful about other factors and disciplines in marketing beyond CRO.
For example, consider how SEO and human resources come into play.
Search engine optimization (SEO), usability, and user accessibility are important to your conversion rate optimization strategy and bottom line.
Balance UX and SEO strategy aspects when setting your goals and making higher-level marketing strategy decisions, as they ultimately impact your website’s conversion rate and total number of conversions.
When planning out your CRO tests, make sure that you’re allocating resources to project management and quality control.
Before beginning your experimentation journey, every team member should know what they are responsible for and understand the goals that your brand is working to achieve.
See if these 11 popular ecommerce KPIs apply to your ecommerce business.
Phase 2 | Quality Input, Quality Output
Great data work in the first phase! Now, it’s time for Phase 2.
This phase will ensure that your testing has useful, accurate data inputs and outputs and that your test ideas are tailored to your unique website and goals.
Step 5: Seek to understand your customers
Because every product, ecommerce store, and customer base is different, it’s important that you work to understand what works best for your brand.
Our advice? Don't rely on traditional “best practices.”
The same applies to any specialized field of work. If I were to ask, “What's the best way to do accounting?” the answer would be that it depends on what your business does.
The same is true for conversion rate optimization.
To truly see results and build a high-performance browsing experience, optimize your website to match client needs in the context of your local market, whether on Amazon, in a Shopify store, or within any other ecommerce platform for online shopping.
Many cookie-cutter “ultimate guide” articles promise a good conversion rate if you just follow their steps or implement certain improvements.
However, digital marketing and ecommerce optimization simply aren’t cut-and-paste.
Contextualize guidance in light of your clients’ unique customer journey.
Advice like “Offer this new payment option," “State the shipping costs upfront,” or “Make the CTA button more prominent” may work wonders for one business but could work against you if it isn't relevant or adapted to your situation.
See which of these ecommerce conversion optimization ideas make sense for your site.
Step 6: Conduct conversion research
A huge part of increasing conversions is doing research to understand the nature of your users’ behavior for both your users who convert and those who don’t.
What worked or didn’t go so well? Why?
Let's look at a few measures you can take now without a team of dedicated researchers. Don’t stress if you can’t address large research undertakings yet—even small, quality investigations go a long way.
Study your Hotjar recordings and heatmaps
This is where setting up your data collection in Step 1 starts to really pay off.
Once you’ve accumulated some recordings, you can use this CRO tool to see exactly what users are doing on your ecommerce site.
Analyze and make notes on your Hotjar data, especially any patterns that you see. This will give you the information you need for Step 7, where you’ll use this data to find problems that need to be addressed.
You can watch and annotate session recordings (leave detailed notes on specific actions that a real website visitor takes) as well as sort your notes and recordings by tag.
Don’t forget to take advantage of Hotjar’s visualization tools!
The Heatmap function shows the concentration of mouse activity across a page for all users combined—for example, an area where people struggle to complete the desired action on the checkout page.
Scroll Depth visually shows how far users get down the page before exiting.
Get feedback from on-site surveys
One of the best places to get information about a user’s session is directly from the source!
On-site surveys gently prompt your shoppers to give feedback about their customer experience—use them to answer specific questions or to gain new, unexpected insights.

Use digital analytics to find leaks
Once you’ve gathered enough customer data, leverage it to uncover your leaks, also known as the underperforming parts of the site, that cost you valuable conversions.
Below are commonly important metrics to consider.
Entry page CVR vs site average
Evaluate performance for your entry points (landing pages) to find which pages are encouraging or discouraging a potential customer from continuing down your conversion funnel.
You’ll also suss out which pages increase certain behaviors from your online shoppers, such as buying instantly or reading more pages.
Looking at how certain pages perform compared with the site average will tell you a lot about what you are doing right.
CVR by device type
Look at your top-performing or highest-traffic landing pages and funnels to find out where visitors could be having trouble using your site on a specific device type.
All too often, we see great desktop homepages that do not translate into great mobile device interfaces (unless you have an app!).
Note that most of the time, customers will be doing product research on their phones. So a mobile-first approach is key to ensuring all users have a great experience on your site.
CVR by channel/source
Consider which channels and mediums are performing well.
Improve low-performing ones, and if needed, consider reallocating your ad spend to another traffic source or target audience.
This is where you’ll see how well you do at converting social media traffic vs organic search traffic or referral traffic.
Step 7: Define your “problem areas”
Take a look at data inputs and patterns in your site's user experience (UX). Ask yourself, “Why?”
Create problem-and-answer hypotheses based on your observations. Try to answer this: “Why is my potential customer not accomplishing [X Goal]?”
For example:
- Cart abandonment rate: Why are my customers clicking “Add to cart” but not completing the checkout process?
- Product pages: Why is Average Session Duration lower on some pages?
- Social proof: Why doesn’t my online store get customer reviews and testimonials?
Now take your top questions and generate possible answers. “Customers are not [accomplishing X Goal] because …”
Taking the product page example above:
“Customers are not achieving a good Average Session Duration on certain pages because…”
- The product image was not clear or enticing.
- The product description was not engaging.
- The product review section was too hidden.
- The Google Ads target audience was more accurate for other pages.
- Load times, plugins, and page speed are slower here, leading to impatience.
- Displayed certifications build trust more successfully elsewhere.
- This page doesn’t have an FAQ or enough informative content to help customers with purchasing decisions.
Group these Q&A hypotheses by their priority and relevance to the goals outlined in Step 4.
Step 8: Create an idea backlog
Take your top “Why?” hypotheses and generate ideas for how you can test your theories—i.e., “Testing X might solve Y.”
Group your test ideas by question to create an organized list.
Let’s say you think there is not enough of a nudge to check out, leading to shopping cart abandonment.
What ideas might solve this issue?
- Put a gentle pop-up reminder after inactivity.
- Make the shopping cart or call to action more prominent.
- Create a sense of urgency with temporary offers.
- Solicit email subscribers early for later lead recapture email marketing (such as a discount coupon for your abandoned cart).
- Reassure users at the checkout stage by displaying or linking shipping costs and the return policy.
Brainstorming these types of solutions will allow you to plan your experimentation roadmap.
Phase 3 | Learn and Optimize
Now that you have an idea of where your customers have trouble, your defined objectives, and your list of test ideas, you can really get started.
This is where the magic happens.
Step 9: Prioritization frameworks
Take the list from Step 8 and apply it to a prioritization framework.
The two models below are popular for being clear and objective: they’re easy to implement and difficult to skew with bias.
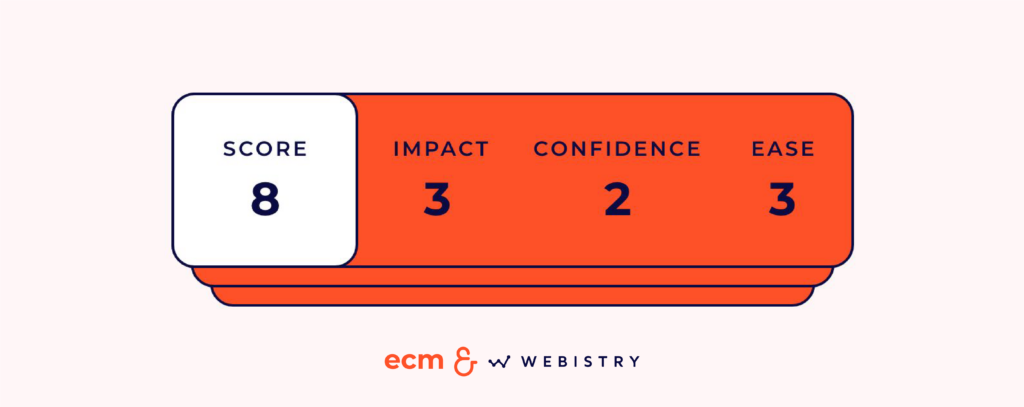
The ICE model
This is the best “simple framework” for organizing experimentation ideas.
You score your ideas on three basic, equally-weighted criteria: Impact, Confidence, and Ease of Implementation. For beginners, test ideas that can achieve impact without requiring too many resources.
The PXL method
PXL uses a weighted scoring system.
You rate 10 specific aspects of your ideas, organizing them based on those quantitative scores, which removes as much bias or subjectivity as possible.
As the PXL method is a more complex version of the ICE model, it's not strictly necessary to use PXL as a beginner.
Low-hanging fruit
Which of your ideas are quick wins that require minimal effort?
Often, they’re your copy or visual tests. More complex updates like checkout optimization, while effective, may take a bit more time to implement (though adding payment methods could be fairly simple).
Change landing page headlines. Update CTA text to be more urgent or actionable. Switch out visuals to make content less busy. Just do it and see what happens. Then rinse and repeat.
Step 10: Design & develop
Once you’ve chosen which test idea to start with, consider the resources you’ll need to execute it.
- Will your design team be involved?
- Is it just a front-end test?
- If not, what’s the scope of web development work required for this project?
If your team’s resources are limited, conduct in-editor tests within an A/B testing platform for now.
While they have less complex capabilities, in-editor tests have great potential and allow you to begin easily.
Split URL vs in-editor tests
A split URL test uses your A/B testing tool to send traffic to two entirely different URLs. These are often used for bigger design changes, like rehauling an entire page.
With an in-editor A/B test, the same webpage (URL) displays different variants to different users. They’re great for simple front-end changes, which often have powerful impact.

Setting up A/B tests
Now, set up the test itself. This process is dependent on your testing platform and test format.
Visual tests can be done directly in your A/B testing platform’s visual editor. This tool lets you visually edit your site pages to create a “variant” experience, tested against your control version from within the platform.
For split tests, work with your dev team to create a duplicate page on your site and apply the changes that you’ll be testing.
Then, go into your A/B testing platform and select “split test” to add the duplicate URL as the variant.
Step 11: Launch your tests & monitor
Do a final check for any necessary benchmarks and back-ups, and get excited – it’s time to launch your test!
Monitor your results right away to make sure things are going smoothly.
Using an Analytics platform, pay close attention to your top KPIs from Step 4.
- Are your users behaving differently once they encounter the change?
- How is it impacting the rate of your conversions?
If you set up in-platform analytics, your A/B testing platform will report on high-level results and even conversion rates for an overview of your test data in one place.
Step 12: Analyze, adjust, and ask questions
When conducting A/B tests, your aim is to scale the changes that should have the most positive impact.
To accomplish this, stop your test once it reaches the projected sample size (see Step 2). Analyze your results using the A/B test calculator, which accounts for your test length and the type of statistical method that you used.
It'll show you how long to continue running your test if the detected changes are currently too small.
If your test results are impactful enough to classify as successful, roll out the change on your site. If the impact were insufficient, implementing or continuing to test this change wouldn't yield positive results.
Once you have your results and calculated analysis, decide your next steps.
Ask “So what?” to the answers that you’ve gotten, and use that response to move on to your “What now?”
To illustrate, let’s use our earlier example: you think there isn’t enough nudge to check out, so your users aren't completing orders despite adding items to their cart.
Say you’ve tested various nudges and reminders to complete a purchase and found that one version outperforms the rest.
In this case, you can scale and apply this to more of your users, which should continue to have positive effects.
But what if the “So what” isn’t as clear? What if none of your new variants performed well, or there was no clear winner?
That means you’ve gained valuable insight into what did not work. Use the insight to regroup and inform your new strategy for solving your problem or goal.
Keep Experimenting with Ecommerce CRO
If you’ve made it this far, congratulations! You’ve taken a valuable step in optimizing your ecommerce website.
The big thing is getting started in a strategic, systematic way, not by guessing.
While this isn't intended to be a comprehensive list of everything to know or try, by following this guide, you'll be on a great path.
Most importantly, it may be much more than your competitors are doing.
Successfully setting up sustainable CRO long-term or even completing even one A/B test can be a lot to take on on your own!
Asking for help in the right places is one of the most important business decisions you can make. Don’t be afraid to explore a CRO partner or agency with niche expertise.
They can set up a well-structured CRO-driven marketing campaign for you to continue yourself or create a more “hands-off” managed solution.
We hope our tips for starting CRO have given you insight into how to begin an experimentation strategy for ecommerce!
What’s next?
Continue running tests to find what works for your vertical and local market, and keep asking questions!
The true value of CRO is in fine-tuning your assets over time based on quality feedback. This is just the beginning.
As well, don’t lose sight of the rest of your marketing funnel when pursuing conversions.
Get involved with the ecommerce community online—it’s a valuable way to gain unexpected knowledge and connections. Try sharing this article with your circle!
To keep getting pro advice and ecommerce growth hacks, subscribe to The Ecomm Manager newsletter.
Thanks for reading! Webistry wishes you the best in your ecommerce journey. Give us a shout if you’re ever in Montréal or if you found this a helpful resource—we’d love to hear from you.
In the meantime, may your conversions be better than ever.
Ecommerce Conversion Optimization FAQs
To wrap things up, let’s answer a few last questions to clarify the topic even further.
What are the benefits of conversion rate optimization for ecommerce brands?
CRO boosts revenue by improving conversion rates without increasing traffic. It enhances user experience and provides valuable customer insights, leading to higher marketing ROI and competitive advantage in the market.
What are some common pitfalls of ecommerce CRO?
Common pitfalls include not having a clear hypothesis before testing, not collecting enough data to reach statistical significance, and making changes based on assumptions without testing.
What are the key metrics to track during CRO?
Key metrics include conversion rate, average order value, cart abandonment rate, bounce rate, and traffic sources. Monitoring these metrics can provide insights into where optimizations can be most impactful.
What tools are commonly used for ecommerce CRO?
Popular tools include Google Analytics for data analysis, Optimizely for A/B testing, Hotjar for heatmaps and user behavior tracking, and Unbounce for landing page optimization.
Note: Some links in this article are part of a paid link collaboration or sponsorship.


