A Guide For Setting Up 3 Essential Ecommerce Reports

This article will cover how to build three essential reports to tell your ecommerce story and share your success.
Since ecommerce is still new in many areas, most people do not know what to ask or where to start when putting together reports.
I’ll help you understand how to look at what is going well, what is not going well, and most importantly, why your stakeholders should care…
- Are you bringing in new customers? In new markets?
- What marketing channels are bringing in buying customers?
- What marketing channels are bringing in new v. return customers?
- What is your average order value (AOV), and is it increasing?
- Are different products selling in your online store vs offline?
- Are you reaching new geographies via your online store?
- Is your average order value larger in your online store than in your brick and mortar store? Why?
I have seen eCommerce business initiatives deliver on all these questions, and unless I would have reported on it, no one would have known.
![]() Why Are Reports Important?
Why Are Reports Important?![]() What Kind Of Reports Do You Need?
What Kind Of Reports Do You Need?![]() 3 Key Reports & How To Set Them Up
3 Key Reports & How To Set Them Up![]() How To Put Your Reports Into Action
How To Put Your Reports Into Action![]() Final Thoughts
Final Thoughts
Why Are Ecommerce Reports Important?
Because you want to be successful. You want your initiatives to be successful. To do these things, you need to be able to share information on your ecommerce performance across your organization.
Awareness and understanding of your ecommerce performance will help you gain support for your work and, selfishly, reporting your ecommerce performance will help you build your own resume, too.
Reporting and analytics provide documented success of your hard work and clearly demonstrate your contribution to your team and company.
What Kind of Ecommerce Performance Reports Do You Need?
You need to put together a plan to report on your performance. Before you dive into the specifics, cover these points to figure out what kind of ecommerce reports you need.
Here are some thought starters:
- Identify what data (for example, Key Performance Indicators) you want to report on and work with your analytics admin to build reports. Are you exclusively reporting on ecommerce sales or are you including overall ecommerce performance including Web analytics, like Google Analytics? Typically, ecommerce managers report on overall ecommerce site performance.
- Determine how you will report your data and insights. Will automated reporting suffice or are curated reports with commentary more appropriate? You can just deliver numbers, but they will not be meaningful unless you use those numbers to tell a story of what is happening on the site. You do not want to just rely on automated reports—especially to your executives.
- Figure out who receives your reports. For example, your immediate team, your manager, executives, or a wider group. Document who receives what. Typically reports are delivered via email.
- Think about how many reports you should deliver. This will depend on what you are reporting, who you are reporting to, and how often.
- Lastly, determine how you are telling your story. Reports communicate data. Analytics interpret the data and provide valuable insight into site performance.Use both reports and analytics to weave your ecommerce site performance story together.
3 Key Ecommerce Reports & How To Set Them Up
Every organization is different, so I will share what I do when making ecommerce reports, and you can make changes based on your needs.
I have always delivered:
- a monthly executive ecommerce performance snapshot supported by a
- monthly operational report that my team uses to manage performance
I also recommend you send a monthly company-wide ecommerce report out to your entire company, to keep your efforts top of mind.
I’ll explain those three ecommerce reports in further detail in the sections below.
1. Monthly Operational Report
First, you will want to put together a report that you and your team use to manage the day to day business. This report will enable you to track ups and downs in all your metrics, from your KPIs, like ecommerce sales, down to your diagnostic metrics, like bounce rate.
This report likely includes 2-3 years’ worth of data (or as much data as you have) and monthly insights, so you can track back if you have a number that does not make sense. If you are resource constrained, you can start with one month of data and then add past data as you go.
If you have all your data in one place, that is great, however, you likely have data in multiple places, i.e. Web analytics tool like Google Analytics, corporate sales tool, email campaigns tool, ecommerce platform, data warehouses, etc.
You will want to create a spreadsheet that includes ecommerce data organized by theme into tabs that allow you to catch any emerging trends or issues.
Operational Report Tab Ideas
Here are some examples of things you can include in each tab of your operational report spreadsheet or workbook.
Tab 1: Summary Metrics
- Visits
- Total Revenue
- Number of Transactions
- AOV
- Conversion Rate
- Customers with Orders
- Unique Visitors
- Bounce Rate
- Product Searches Per Visitor
- New Online Accounts
- App Downloads

Tab 2: Traffic & Engagement Metrics
- Visits
- Visitors
- Time on Site
- Pages Viewed
- Site Search & Product Searches
- Landing Page Performance
- Failed Searches
You can also include other metrics that indicate how much traffic you are getting and what that traffic is doing.
Tab 3: Marketing Channel Metrics
Report on your marketing efforts and corresponding KPIs by channel, so if your KPIs are visits, orders, sales, conversion, and bounce, then report on how your marketing channels contribute to each KPI.
For example:
- PPC
- SEO
- email campaigns
- coupon codes
- social media
Tab 4: Mobile metrics
- Visits
- App downloads
- Downloads by platform (Apple, Android)
- Pages per session
- Time per session
- Orders
- New customers
- Returning customers
- Log-ins
- Customer support tickets
Tab 5: Product metrics
Sales by product category in dollars and units. You may also include visits to product detail pages.
Tab 6: Geographic metrics
Total revenue by geography in dollars and units. This could be by country, continent, state, DMA or whatever makes sense for your business.
Tab 7: Insights
Outline any major events or activities that would have impacted ecommerce sales performance or other KPIs.
For example:
- If there was a weather event that negatively impacted sales in 2019, in 2020 your business will likely be up, and you will want to be able to explain that.
- If you’ve made any changes to your user experience, those changes may negatively or positively impact your performance.
- If you’ve changed your marketing and media spend, that may impact sales. If your paid search budget is cut, you will see an immediate impact to sales. That impact may also have longer term effects, like revenue building from repeat customers that the media would have brought in.
Document these things so you can effectively manage changes in your performance and explain those to others.
Example Tab For Key Metrics In Monthly Operational Report
Here’s a screenshot of the Key Metrics tab in my Monthly Operational Report. I wrote the parts below in bullet points as well for reference:
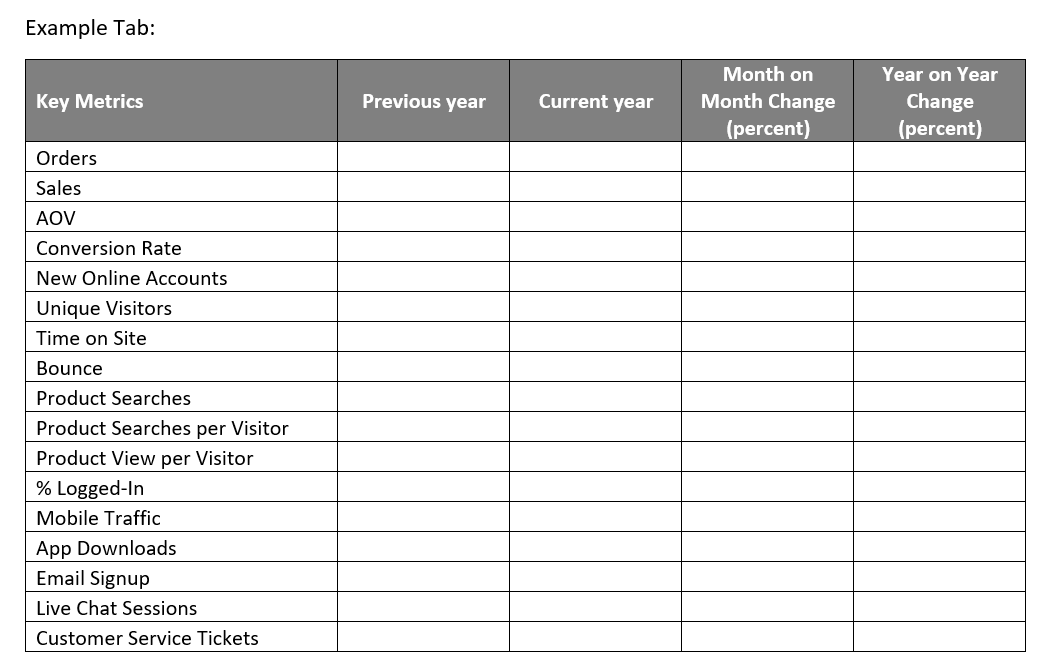
For quick reference, here are the columns I use:
- Previous year
- Current year
- Month on Month Change (percent)
- Year on Year Change (percent)
And these are the key metrics I track according to those columns:
- Orders
- Sales
- AOV
- ecommerce Conversion Rate
- New Online ecommerce Store Accounts
- Unique Visitors
- Time on Site
- Bounce
- Site Searches
- Product Searches per Visitor
- Total Number of Product Detail Page View per Visitor
- % Logged-In
- Mobile Traffic
- Total Number of App Downloads
- Email Campaigns Signup
- Total Number of Live Chat Sessions
- Customer Service Tickets
What Can You Use A Monthly Operational Report For?
You will use a monthly operational report for ecommerce to determine what is working and what is not.
For example:
- Are your numbers increasing or decreasing? Use an automatic red or green highlight in Excel to easily see changes.
- Can you identify patterns and trends in your ecommerce data that enable you to forecast future performance? For example, does the weather impact your sales? Or, is seasonality like back to school more important?
- Can you find correlations between metrics? For example, if traffic goes up but ecommerce conversion rate stays the same, then your sales should increase. Thus, will driving more traffic increase your sales?
- Connect launches and changes to your user experience. For example, map new features and functionality to any changes in performance.
- Identify anomalies and try to determine why they occurred. Anytime you see performance that is off pattern, make sure to investigate it. It could be a one-off event or there could be an issue with one of your data reporting sources.
Ideally you want to determine what levers will drive up your ecommerce sales and drive down your cost to operate the site.
These costs might include your marketing campaign costs and costs to serve the customer.
For example:
- If you know email marketing campaigns bring in the greatest number of return customers, invest in email marketing initiatives and useful ecommerce tools and add-ons like cart abandonment prevention, order management, and promotions planning.
- If you know pay per click advertising (PPC) brings in the greatest number of new customers (as customers communicate intent through product searches), then increase your PPC spend.
- You don't have to go it alone. Instead, rely on AI-powered tools like demand side platforms to help manage, distribute, and optimize your PPC ad spend.
- If you are early in your ecommerce journey, you are likely not 100% optimized in your marketing campaigns or maxed out on your spend. Keep optimizing and trying new things.
When To Use It? Example Monthly Operational Report Schedule
Here’s how you can go about getting the data, building the report, and sharing it:
3rd day of month the month = Final Data
You may get your web data in real time from your Google Analytics account, but your end of month close may take longer.
3-7th day of the month = Report Built and Reviewed
This is where you actually add your data, make your calculations, create your charts, and check your work.
10th day of the month = Monthly report delivered
This includes team review and discussion. Feedback received and incorporated before work on the next month’s report begins.
You must have good ecommerce data to deliver solid, reliable reporting. Coordinate with your IT or business intelligence teams for enterprise data, and ensure your site includes proper ecommerce tracking from a reliable ecommerce analytics tool like Google Analytics. If you have a concern about the quality of your ecommerce data, check it and recheck it. Integrity is everything.
Tips For Making A Great Monthly Operational Report For Ecommerce
- You may also want to add in additional tabs for graphs and charts, or, those can be added at the bottom of your individual tabs.
- Make sure you format your pages for printing to save time later.
- You may also want to add a tab that defines your ecommerce data sources for each tab, for example, sales and orders come from your ecommerce platform analytics report, traffic information comes from Google Analytics, etc.
Related Read: 10 Best Ecommerce Marketing Tools To Add To Your Marketing Strategy
2. Monthly Executive Report (An Ecommerce Performance Snapshot)
Typically, executives are looking for a high-level ecommerce overview including metrics they already understand with a few web-specific metrics.
These metrics might be sales, new customers, average order value (AOV), plus things like visits, new visitors, and conversion rate.
They may also be interested in things like shopping behavior. For example, do users coming to the site via search engine behave differently than users coming in from an email marketing campaign?
To get started, you can put together a draft report and share it with your manager or your executive team for feedback. Your report data can be pulled from the Monthly Operational Report (above). If schedules are tight, you can build both at the same time.
Then, once you start delivering the report you can incorporate feedback as it comes in.
The objective of the executive ecommerce overview report is to demonstrate the health of your ecommerce business, explain any issues, and to build confidence in trust in your efforts.
You will have to report the good along with the bad, so if there is a miss, cover it in the report and be ready to answer questions.
If the CEO shows up in your office (this has happened to me), you’ll have a great opportunity to show you’re already on top of any issues.
Sample Ecommerce Executive Performance Snapshot
- Period + Year
- Metric
- Prior Year
- Current Year
- % Change
- Visits
- Total ecommerce Sales
- Sales from Returning Customers
- Orders
- AOV
- Active Customers
- Conversion Rate
- Cart Size
Your accompanying text might look something like the text below. You can use this as your ecommerce executive summary template:
With nearly $XXX,XXX in ecommerce revenue during the period, sales rose XX% year on year (YOY) compared to the same period last year.
This translates to a XX% increase month on month (MOM) and brings our year to date (YTD) growth up to XX% at the end of the half. Not only did we surpass our daily sales record of $XX,XXX for the 1st time but we also had X such days, beating the previous year by X%.
Returning visitors generated XX% of sales with a X.X% conversion rate. After the release of our <mention new functionality or features> during the period, the conversion rate improved to X.X% for returning visitors and the new visitor rate rose above X%, up from X.X%.
Additional Info You Can Include In An Executive Report For Ecommerce
- Information on how well you did against your ecommerce sales forecasts if you have them.
- Monthly ecommerce sales for the last two years and graph comparing the two.
- A breakdown of ecommerce sales by geography or product category.
- Commentary on referring marketing channels, i.e. where your growth is coming from. This could include the platform (desktop v. mobile v. tablet) and it could also include your marketing channels or traffic sources, like email marketing campaigns, paid media and PPC, SEO, affiliate programs, social media, etc.
Tips For Making Your Executive Report Great
Format: I would recommend laying this type of report out in a word document and then having a graphic designer ensure it looks great and is on-brand. Deliver the final report in PDF format.
Feedback: Once your ecommerce sales snapshot is complete, share it with your immediate team and manager, and then put together a wider list of stakeholders to send your report to. Request feedback by a certain date, then incorporate that feedback, then continue sending your report.
Subject Line: When you send it out, always send it out with a consistent subject line. For example: Executive ecommerce Performance Snapshot—March 2020. If appropriate, include a glossary of terms at the end of your report.
Note: Keep in mind that if your executive report goes out widely—for example, to sales leaders—they may want their own reporting. They might ask for a report by geography or product line. Consider your commitments carefully and do what you can to automate regular reports that do not require a story.
Monthly Executive Ecommerce Report Example
Here is an example of what your monthly executive ecommerce report could look like:

3. Company-Wide Ecommerce Reporting
No matter what type of company you work for, ecommerce is likely a hot topic these days. Just as it is important to keep your team and executives in the loop on your ecommerce business, you will also want to keep others in your organization in the loop.
A few common examples:
The finance team may want to better understand how you are spending the company’s money.
Associates in your bricks and mortar stores may want to understand how many customers are buying online v. buying in the store.
Supply chain managers may want to look for increases in ecommerce sales to determine if new ecommerce specific distribution channels should be set up.
Category managers may be looking for a product performance report with details on product revenue and product page performance.
Using your Operational report, pull out a few metrics that would be of interest to a wider audience.
Here are some examples:
- Numbers of visitors
- Number of transactions
- Overall ecommerce revenue
- Average order value
You should also include information on any upcoming new features, functionality, and upgrades.
Tips For Excellent Company-Wide Ecommerce Reporting
“Wow factor”: What will get folks’ attention? For example, is your online sale AOV greater than your in-store sale? Do you have a relatively small company, say, 50 folks, but you see 50,000 unique visitors a month? Think about what would surprise and delight your colleagues and get them talking about ecommerce.
Confidentiality: Do keep in mind that distribution of information to a wider group may increase the possibility that this information may get shared outside of your company even if it is marked confidential. Thus, you may want to limit the information you share company wide.
Simple design: Write up what you are looking for as report requirements with sample data and having the marketing team design an on-brand email template to use for the report. Since you will be reaching a wider audience, some of whom may or may not connect with numbers, you’ll want to go for a more interactive format.
Visuals: Add a screenshot or two to bring the communication to life.
Company-Wide Ecommerce Report Example
Here is an example of what your company-wide ecommerce report might look like:

Putting Your Ecommerce Reports Into Action
So, how do you use these ecommerce reports in real life?
1. Refine your Monthly Operational Report
You will want to build your Monthly Operational Report first and share that with your immediate team and manager for feedback. They will likely have a lot of great ideas that you have not thought of. Listen to their perspectives and incorporate their input.
Once the report is final, meet monthly to review the report and determine action plans to maximize your growth or address any areas of concern.
If your team is large, you may consider assigning specific metrics to specific team members, for example, you may ask your user experience team to monitor the bounce rate and your digital marketing team to monitor new customers.
Note: Over the first few months, you will likely modify your report as you put it into practice. Welcome this, as you will want to ensure your ecommerce report works for everyone on the team and they feel like they are part of the process.
2. Start using Executive and Company-Wide Reports
Once your Monthly Operational Report is built out, you will want to build out your Executive Report and Company-Wide Ecommerce Report.
This gives you time to iron out the wrinkles before taking your reporting to a broader audience with more diverse interests.
Final Thoughts On Ecommerce Reporting
The most important thing about your reports is that they are accurate and consistent.
Ecommerce can be intimidating, especially to those who are unfamiliar with ecommerce and its unique terminology. Others outside of the immediate ecommerce team may not understand why they should care. Keep this in mind as you put together your reporting plans.
This approach to reporting has been invaluable to me over the years in keeping my immediate team and a wider group of stakeholders in the loop on ecommerce business performance. Good luck!